Project: Weather App
The project is done in groups of 2–3 students.
The input of each member of the group must be visible in the program!
Deadlines
Final submission: Friday, 8.12.2023, 23:59.
Grace period ends: Friday, 15.12.2023, 23:59.
A grace period starts automatically after the actual deadline.
Any submission during the grace period means that the actual deadline was missed.
Even under grace, submit the project as early as possbile as the grading gets tougher over time.
The limit to pass (grade 1) does not change.
As the grace period starts, limits for other grades are raised by half a grade. For example, right after the actual deadline, a project must gain points worth the grade of 4.5 for the grade of 4, the limit for the grade of 3 is that of 3.5, etc.
The limits are raised gradually over the grace period so that by the end of the period the limit for the grade of 4 is the same as the original limit for the grade 5. The other grades scale accordingly.
A project that does not fulfill the minimum requirements can receive a so called boomerang. In this case, an extra week is given to fix the project implementation.
Learning Outcomes
You practise the following things:
Adding functionality to a program using object oriented design.
Using external libraries as a part of the implementation (design by contract).
Implementing a GUI as a part of the program.
Unit testing your own code.
Implementing a program as a team effort.
Implementation
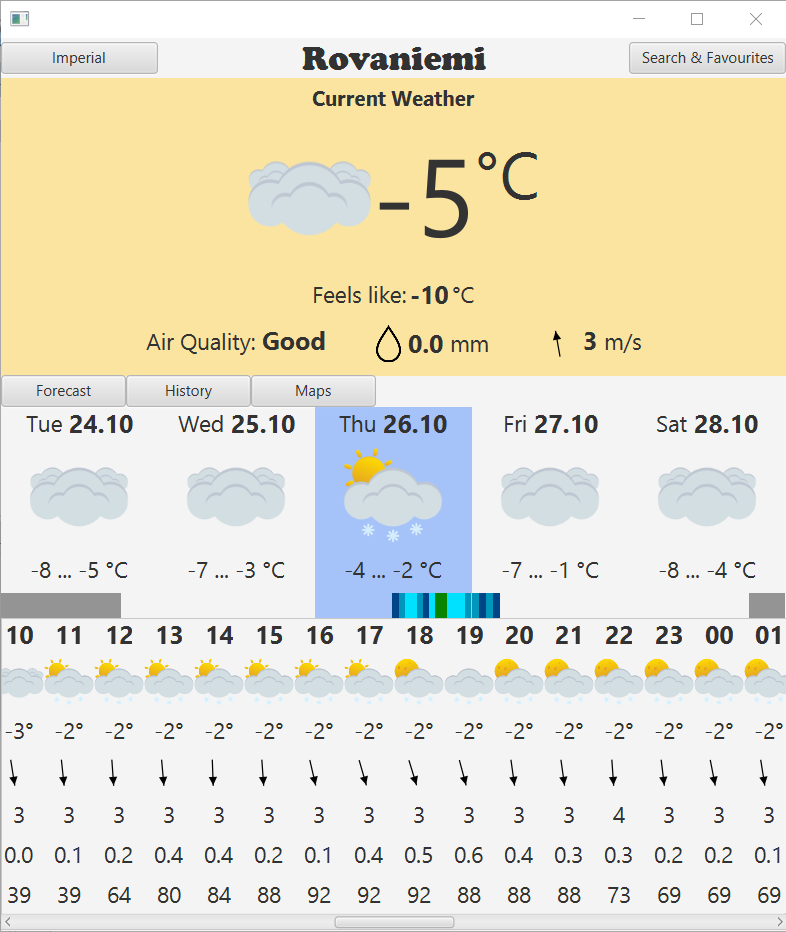
Knowing the weather forecast of coming days has many benefits, including planning outdoors activities and choosing appropriate clothing for the day. To make it easier to keep track of the weather you decide to build a program which fetches weather data from the internet and visualises the data using a graphical user interface. The program allows the user to check the weather forecast for different locations, allows the user to save often viewed locations as favourites and remembers the last viewed location whenever the program is opened. There are also maps that display things like rain intensity.
The project uses free weather data provided by OpenWeatherMap.
Program Use
The project team has a lot of leeway in how they want to implement the functionality of the program. Here’s one example of how the program could function, but it’s recommended to also check out other examples of weather applications, like the ones by FMI or Foreca.
When the program opens, the last viewed location is shown. A search for locations and the option to save them as favourites is available in a separate window. Weather maps also have a window of their own. The main window displays the current weather, as well as a forecast for the next few days. The forecast consists of a daily aggregate displaying things like the minimum and the maximum temperature for that day and a more detailed hourly forecast. In the aggregate part the day which is currently displayed in the hourly forecast is highlighted.
When the program is closed, the currently shown location, location search history and favourite locations are saved to disc in JSON format.
Below is a draft of what the UI might look like:
Many details of the program implementation are intentionally left open and they can be implemented as the team sees fit. Such details include:
How the program starts: What is the start state of the program and what information it requests from the user at start, if any?
The user interface: How are the program functions accessed through the UI?
The user’s role in the program: How does the user find the information they want?
Visualising weather information: What is displayed to the user and how is it displayed?
A simple JavaFX project, which creates an empty window, has been given in the remote group repository. The project is done with Maven and can be opened in NetBeans without any modifications. This project skeleton is meant (as it is) for mainly those who plan to achieve the grade of 1.
Program Features
You must implement at least the minimum requirements to get the project work accepted. Moreover, by implementing optional additional requirements and extra-work you can increase your grade. With the minimum implementation you can pass (grade 1). Implementing the requirements set for the intermediate implementation, you can get the grade 3 at maximum. A higher grade requires the implementation of some additional features.
The points collected from the project form a partial grade with grade = points / 100. The project amounts to 35% of the course grade.
Minimum Requirements
The grade of 1 at maximum. Maximum of 140 points.
The minimum implementation must contain the following features:
The program compiles.
The program uses the course provided user interface as its main window.
The program allows the user to search for different locations.
The program displays the current weather and a simple forecast. At least three different data types must be shown (e.g. temperature, rain intensity, wind speed).
The program uses the weather icons provided by OpenWeatherMap.
Uses at least one of the provided interfaces (iAPI.java or iReadAndWriteToFile.java). The interfaces can be modified if the program structure requires it.
The project version history is visible in gitlab.
A final document that contains:
Class responsibilities. The UML class diagram is a good tool for this.
Division of labour in the team.
More project points can be collected by implementing intermediate and additional requirements and by other merits of the project (extra-work).
Intermediate Requirements
The grade of 3 at maximum.
The intermediate implementation meets all the minimum requirements with the following additions and changes:
A graphical user interface has been implemented by the team. If the user interface is based on the readily-provided JavaFX project, the team’s user interface must be clearly unique, when compared to the provided interface.
The program allows saving locations as favourites.
The state of the program (the current location and favourite locations) are saved to disc when closing the program, and restored when the program restarts.
Instead of the simple forecast a more detailed forecast is implemented, which includes both an hourly forecast and a daily aggregate. The aggregate must include at least the minimum and maximum temperatures for that day.
The program uses a custom set of icons (not those provided by OpenWeatherMap). There must be a larger number of different icons used than what OpenWeatherMap provides.
The program handles errors during file processing.
Unit tests have been implemented for the program.
Extra-points can be collected by implementing additional requirements or extra-work. One additional requirement is worth 25–100 points. Extra-points can compensate up to one grade’s worth of mistakes.
Top-Grade Requirements
The grade of 5 at maximum.
In addition to the minimum and intermediate requirements:
At least two additional requirements have been implemented. One additional requirement is worth 25–100 points.
Points from the additional features can compensate up to one grade’s worth of mistakes. In addition, also extra-work can provide extra-points.
Additional Requirements
The features listed below do not need to be implemented, but a good implementation is worth an increase in the grade. Each additional feature is worth 25–100 extra-points. The effect of a feature can be increased, if it turns out to require more work than expected. In order to get the grade increase, the feature must be documented in the submission. The TAs do not search for additional features from the code.
Weather Maps. A weather map consists of a map base and map data obtained from OpenWeatherMap. The map can also be animated, displaying weather data for several different time points.
Usage of charts. The program uses charts to display some data, like temperature or rain intensity.
Location search history. Recently searched locations are kept in memory and displayed to the user to make it easier to go back to them later. Search history is also saved in JSON format and restored on program restart.
Supporting multiple systems of units of measurement. OpenWeatherMap provides some data in various different units, mainly SI and imperial. The program is able to show data using both of these systems, as the data retrieved from the service allows.
Unit tests have been implemented for the graphical user interface. Use the TestFX framework for testing JavaFX programs.
Own feature. An additional feature outside this list has been implemented. Note! The feature needs to clearly require coding.
Note! All additional features must clearly require coding.
Note! ALL ADDITIONAL FEATURES MUST BE DOCUMENTED TO GET THE POINTS.
Extra-work
In addition to the additional features, extra-work can provide extra-points:
Nice graphics.
A very good GUI.
Well-documented interfaces and classes.
Grade Calculation
The grade is determined by the sum of the points of the implementation level (minimum, intermediate or top-grade) and the extra-points from the possible implementation of additional requirements and possible extra-work. Final maximum grade is limited by as described in the previous subsections.
Graded sections:
Overall design and structure
Class design and implementation:
Proper principles in object-oriented programming.
Documentation of classes and interfaces.
Exception handling:
Proper usage and handling of exceptions.
Code quality:
Following good programming principles.
Style.
Version history and teamwork.
Extra-points:
Awarded for additional requirements and extra-work investested to implement features especially well.
Environment
Remote Group Repository
A remote GitLab group repository has been created for each group. The repository can be found at
https://course-gitlab.tuni.fi/compcs140-fall2023/group----,
where ---- is the group id of Plussa. For example, if a group’s id is 1234, the
group’s remote repository is at
https://course-gitlab.tuni.fi/compcs140-fall2023/group1234.
The repository contains a simple JavaFX project. The project is in the Maven form and can be opened with the NetBeans IDE. Clone this repository as your local repository.
Set the remote repository of the project material as a remote to your local repository to fetch possible course side changes.
Please, contact the course staff via the course email (prog3@tuni.fi), if your
group’s remote repository is missing.
The use of version control is both a graded part of the project and an indication of team work. The remote repository must contain a clear contribution from each member of the team.
Continuous Integration
The root directory of the remote project repository has the .gitlab-ci.yml
file that configures how GitLab runs the so called CI/CD pipeline. The pipeline
supports the practise of continuous integration by executing tasks defined
in .gitlab-ci.yml when a developer pushes to the remote repository. The file
has the pre-defined build task that compiles the project with Maven.
The use of the CI/CD pipeline is optional. Rename the .gitlab-ci.yml file or
delete it, if you do not want that pushing triggers the compilation. However,
please note that the CI/CD pipeline is a way to detect broken code that should not
be pushed to begin with.
In this task, the group can augment the continuous integration with
testing. GitLab has a runner that executes the test task, if the group has
defined it in .gitlab-ci.yml by themselves. Please give the compcs140
tag for this task too. By defining the test task, a group can bolster
the testing of their project work, and in doing so possibly gain extra-work
extra-points.
Using OpenWeatherMap
In order to retrieve weather data from OpenWeatherMap a user account must first be created. On the upper right corner of the front page click the link “Sign In” and create a new account by clicking “Create Account”. Use your university email (@tuni.fi) when creating the account. Once you have created your account, log in and navigate to the “My API keys” page. It’s likely you already have an API key available, but if not, you can create one on this page. It will take some hours for the key to become functional. The API key is required for all requests made to OpenWeatherMap.
The free version of OpenWeatherMap is quite limited, but there is a student plan available which unlocks some extra features. You can apply for the student plan on this page. Examples of additional features included in the student plan are weather maps, hourly forecast and historical data, so if the team intends to implement more than the minimum requirements having access to the student plan is a must. It can take several days for the student access to be granted, so it’s recommended to apply for it sooner rather than later.
On the OpenWeatherMap website you’ll also find instructions on how to use their API. As an example, the instructions for the current weather API can be found here: https://openweathermap.org/current By default the API response is always in JSON format, but other formats are available if required. Most of the API-requests require the coordinates of the desired location. OpenWeatherMap also has a Geocoding API which can be used to convert location names into coordinates. It’s permitted to use other geocoding services if required, but the one provided by OpenWeatherMap should have all the features needed in the project.
Probably the easiest way to find the API instructions is looking at the pricing page. The student plan includes “Current weather and forecast” at Developer level and “Historical weather collection” at Medium level.