Tables
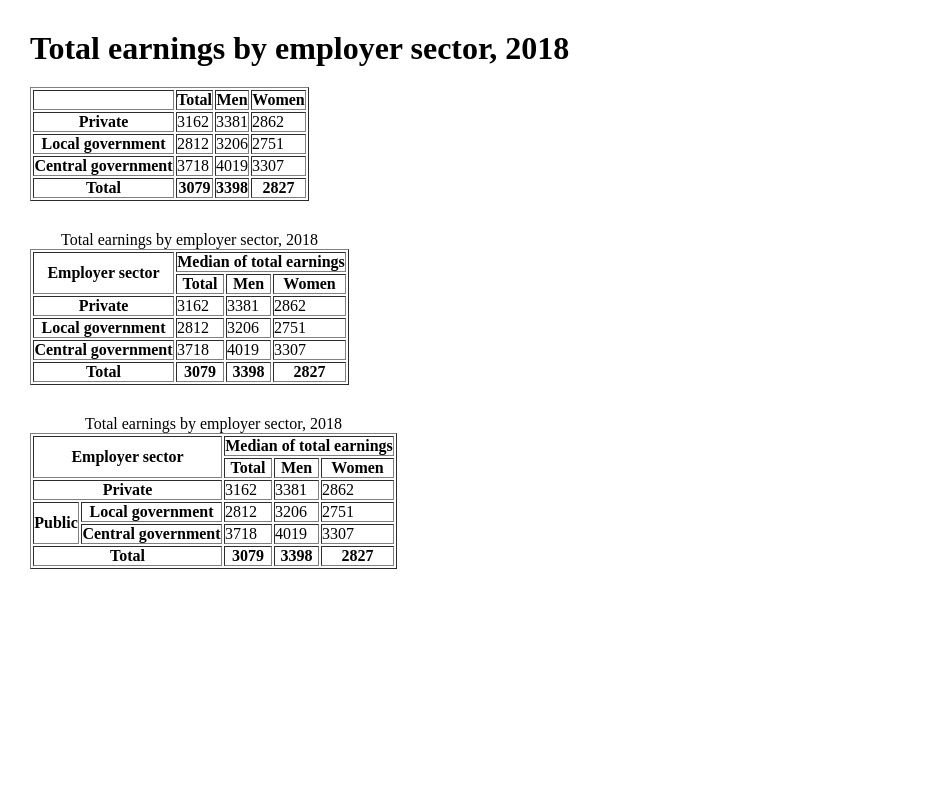
Total earnings by employer sector, 2018
Download table.xlsx
What you’re going build
In this assignment you are going to build three tables that all have the same data of Total earnings by employer sector, 2018 taken from Statistics Finland (http://www.stat.fi/tup/suoluk/suoluk_palkat_en.html). Each table is formatted a bit differently than the previous one. The image below shows the result you are aiming for.
How you’re going to build it
In this exercise you will create three tables (<table>). The first one is a very simple representation of the data published by Statistics Finland. The second one adds a caption and some extra heading cells and cells spanning multiple rows and/or columns finally the third and last table will have cells of different width and height in the same column.
Note 1: As in the previous assignment you are not required to follow these steps if you don’t want to or are more experienced but you should still read them through. Again only the final HTML will be required in the assignment submission and strict following of the steps below is not required.
Note 2: In this exercise you can use the border attribute for the tables (<table border=”1”>). This is because otherwise the tables will not have any borders by default and it is much easier to visualize the structure of the table with visible borders. The validator will complain about this but the automatic grader will ignore that. Later in this course you should not use the border attribute because all borders in HTML should be the responsibility of CSS styles.
1. Start by creating the first table as shown in the image above. You can get the data by downloading the Excel spreadsheet or just see the image above. Anything that is in bold text in the image is a table headings cell <th> and everything else is a regular data cell <td>. Finally give this table id “t1”. Note: The top left empty cell is a heading cell <th>. This is important because the automatic grading will check for that. Check your results in a browser and validate the HTML before moving on.
2. Make another version of the table containing the same data but this time add a caption to the table (<caption>). Then add “Employer sector” to the empty top left heading cell as shown in the image above. Then add a new headings next to it with the text “Median of total earnings”. Finally stretch the top left cell to span two rows and its neighboring cell with the text “Median of total earnings” in it to span three columns (rowspan and colspan attributes are your friends here). Validate your HTML before continuing. Give this second table id “t2”. Note: If a cell spans many rows or columns the adjacent rows/columns should have fewer cells to leave space for the spanning cells.
3. Make the third version of the table based on the second one above but divide local and central government in it marked as a public employer as shown in the picture above. Again you can stretch cells with rowspan and colspan attributes. Give this third table id “t3”. Note: If necessary a cell can span both multiple rows as well as multiple columns.
4. Your HTML should now have three tables with IDs: “t1, t2, and t3”. Double check everything and validate your HTML. Congratulations! You should now be ready to submit your HTML.
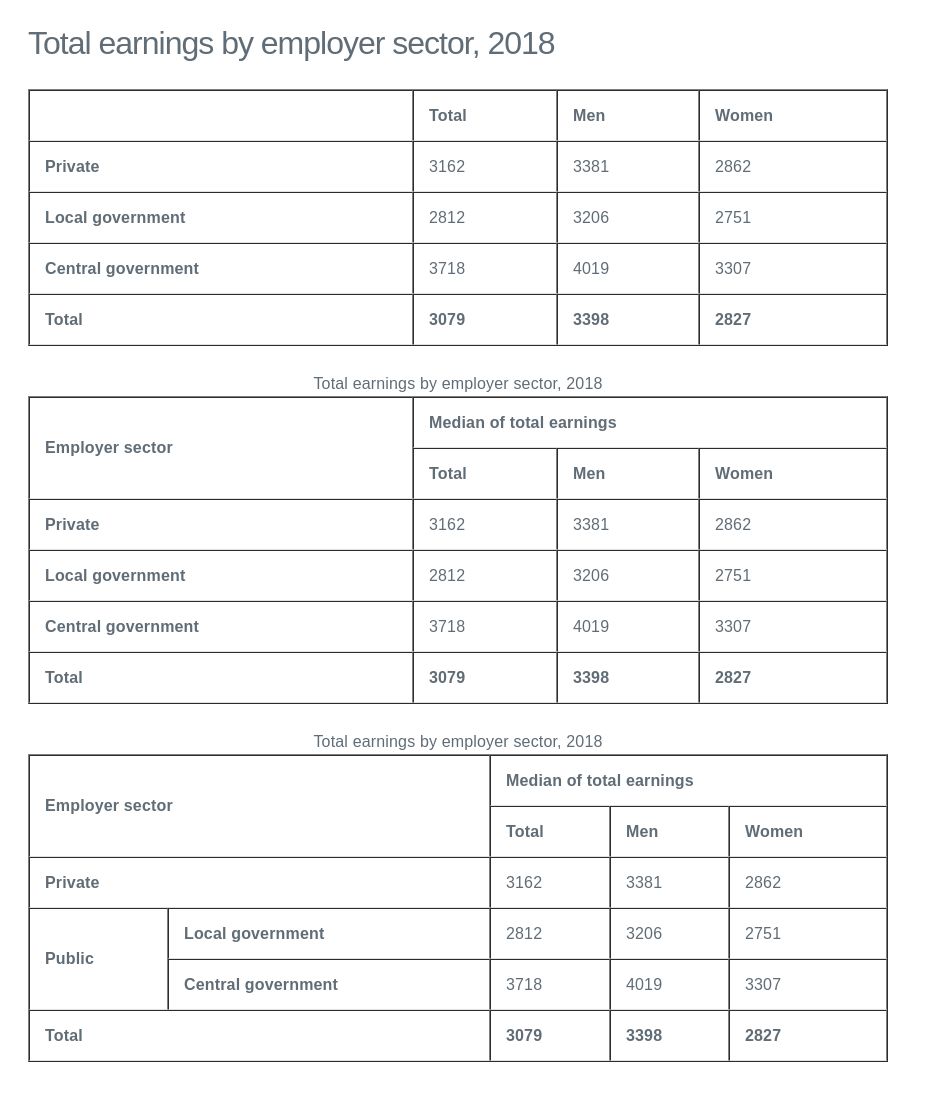
Bonus: The page does not have any visual formatting (no css rules), the default browser formatting is used. However, if you link the stylesheet of the previous HTML assignment (the lasagna recipe) to this page (you should know how by now) the page will resemble the one shown in the image below. This is just a demonstration of the usefulness and utility of stylesheets. No extra points for this one.
A+ presents the exercise submission form here.