- COMP.CS.200
- 7. JavaScript: FP & async (assignment)
- 7.7 Co-authors as sociogram
Co-authors as sociogram
Attention
This exercise should be done in groups and submitted as a group.
Include all group members and make sure that everyone knows how your solution works. Only one group member needs to submit the exercise on behalf of the whole group.
In this exercise, you fetch data from library API. First, you insert a search term to a text box and then press Search button. In the background, script searches the data and returns it as JSON.
However, you must serve publications in a right JSON format, the format shown below. The conversion function is ready-made, you have to just find the right one in coauthorsjson.js file.
The resulting JSON object should look like this:
{
  "name": "javascript functional",
  "pid": null,
  "titles": [],
  "size": "20500",
  "children": [
    {
      "name": "Alexander Sobolev",
      "pid": "281/4693",
      "titles": [
        "Functional Programming Patterns in JavaScript"
      ],
      "size": "2500",
      "children": [
        {
          "name": "Sergey V. Zykov",
          "size": 500
        }
      ]
    },
    ...
  ]
};
We are using D3 library to draw the sociogram. D3 force.js is needed for drawing. Example is described in a more detail here: https://bl.ocks.org/mbostock/1093130. It has a function to be called to init the sociogram visualization, see the figure below.
Next, you have to pass the JSON file to it and update the just initialized but empty sociogram graph with the help of another function in force.js.
Checking the D3 example above may help.
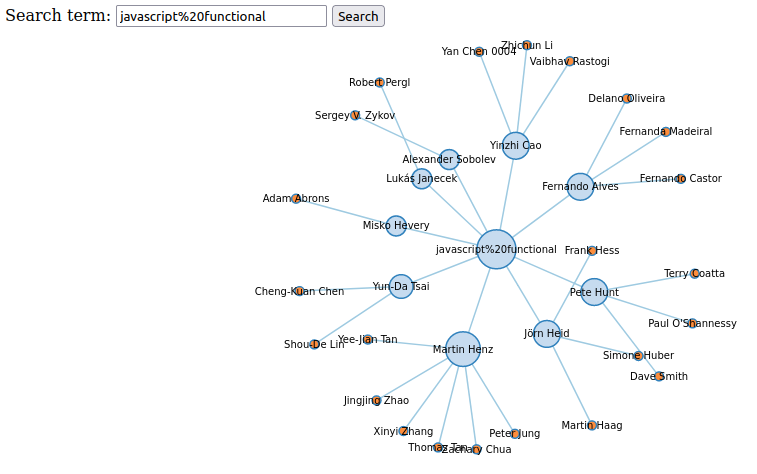
Your submission is ready when the sociogram will be drawn on a button press and it shows all author nodes, and javascrip%20functional as the root node.
The sociogram works also with arbitrary search terms, but in a background, the library API that is used in searches primarily anticipates to get technical search terms.
Download the templates
Instructions
Start by downloading the template files zipped as
coauthorsjson.zip.Implement TODOs in coauthorsjson.js.
Open
coauthorsjson.htmlin a browser. To get things to happen, press Search button, and the form is submitted. After the key press, the publication data should appear visualized as a sociogram, see Fig.1.
Attention
The data is fetched from a server and it may be updated from time to time and the image below is meant only as an example and the number of authors (nodes in the image) may be different!

A+ presents the exercise submission form here.