Stack Overflow Statistics
Attention
This exercise should be done in groups and submitted as a group.
Include all group members and make sure that everyone knows how your solution works. Only one group member needs to submit the exercise on behalf of the whole group.
In this exercise, you are given statistics collected from Stack Overflow Annual Developer Survey Your task is to represent that data in a table using JavaScript.
Download the template
Instructions
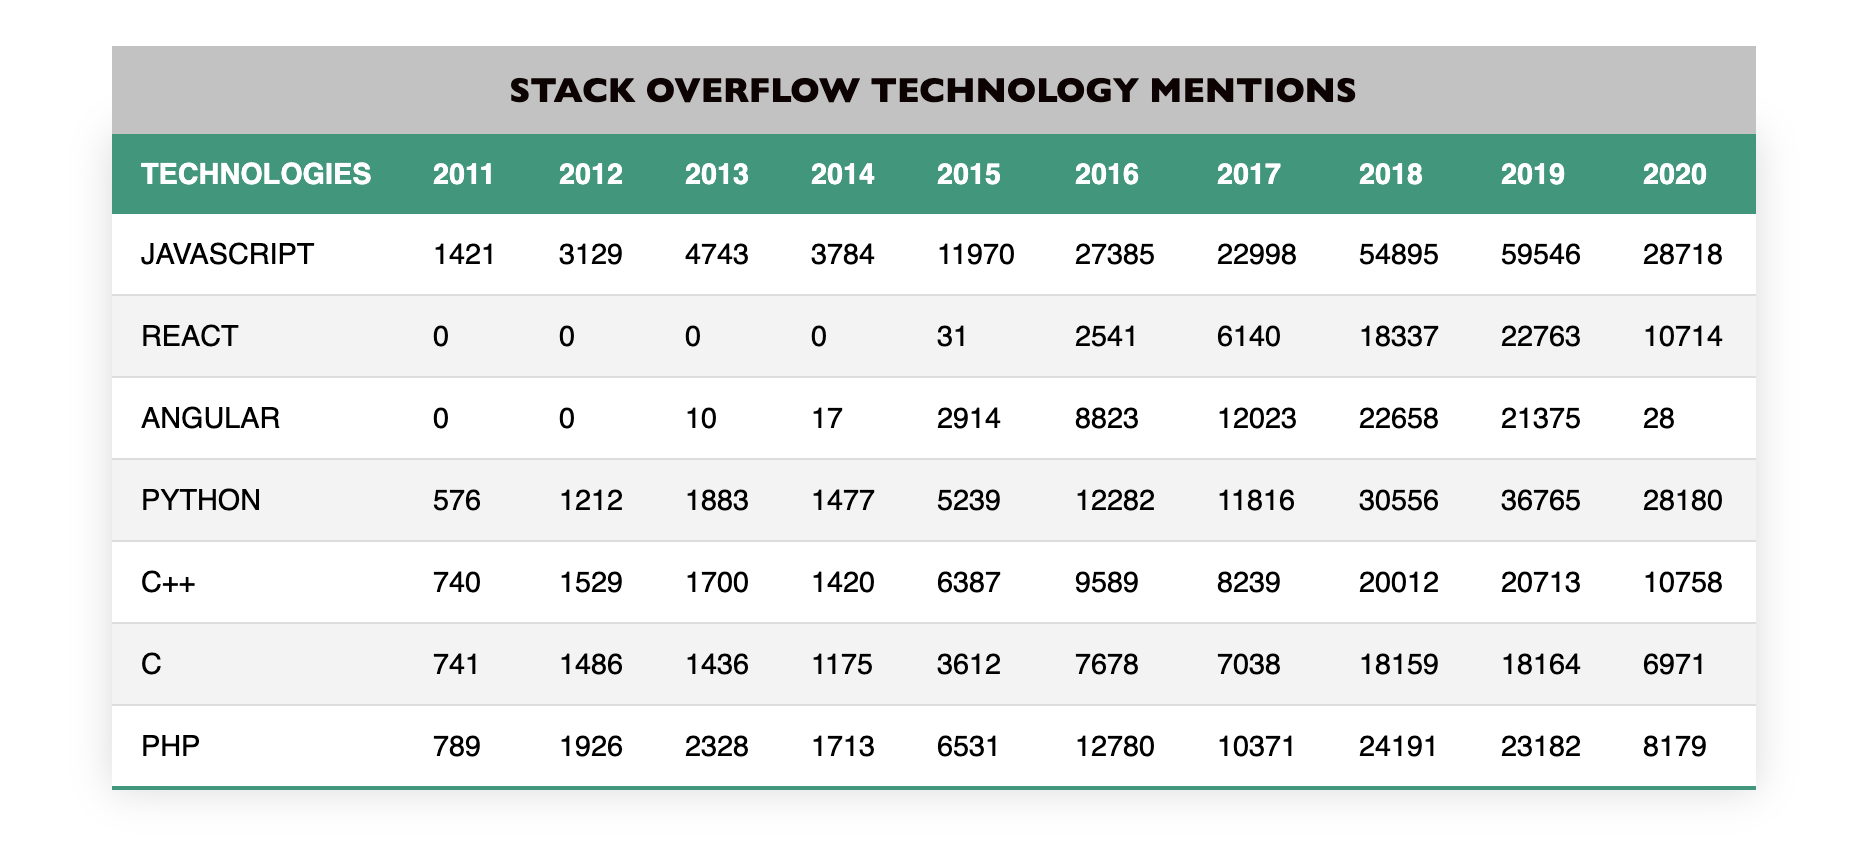
In this exercise you will implement three functions which take the statistics data and build HTML table representation of the data. The image above shows the expected result.
Begin by downloading and extracting the exercise files. You should have the following five files:
functions.jsthis file is for your functions. You will edit and submit only this file.index.htmlthis file is responsible for loading all the other files and showing the final results.style.cssstylesheet to make the table look like the one in the image above.index.jsis responsible for calling all the functions you implement and then updating the HTML table based on the results.techStats.jsthis file contains yearly numbers of people who were at the time of the survey working with each technology. The structure of the data is shown below (although there will be more data):const techStats = { 2011: { JavaScript: 1421, Java: 919, PHP: 789, Python: 576 }, 2012: { Java: 2349, JavaScript: 3129, PHP: 1926, Python: 1212 }, 2013: { Java: 3024, JavaScript: 4743, PHP: 2328, Python: 1883, } };
The object techStats has keys for each year and the values are other objects which each have the technologies as keys and the number of mentions of each particular technology as values.
Your task is to implement the following three functions described in the
functions.js file:
buildRowData(yearlyTechStats, selectedTechs, firstYear, lastYear)
Will receive the techStats object or similar object as its first parameter yearlyTechStats (Do not assume it to be the exact same object!!)
The second parameter selectedTechs is an array of technologies which are selected to be shown in the HTML table
The last two parameter firstYear and lastYear are integers representing the range of years from the statistics to be included in the HTML table. You can assume that firstYear <= lastYear
The function should return an array of arrays where each inner array represents one row in the HTML table. First item should be the name of the technology and the others are the number of mentions for each selected year. The return value should be similar to the following (if selected technologies were “JavaScript” and “PHP” and years 2012-2013):
[
  ["JavaScript", 3129, 4743],
  ["PHP", 1926, 2328]
]
For any year and/or technology where there doesn’t exist any statistics the number of mentions should be 0 (zero). You need to check for undefined or non-existent values.
constructTableRowsHtml(rowData)
Takes parameter rowData which an array of arrays of the same format
buildRowData()function returnsReturns the HTML of the table rows based on the rowData The returned HTML should be a single string having the following format for each table row:
<tr><td>JavaScript</td><td>3129</td><td>4743</td></tr>
constructTableHeadHtml(headings)
Takes array of headings as its only argument
returns a string of the HTML of the table heading row based on the supplied headings
If headings is the following: [“Technology”, 2012, 2013] the resulting HTML should look like this:
<tr><th>Technology</th><th>2012</th><th>2013</th></tr>
NOTE 1: The functions you implement here are needed in the next exercise. That is, you must complete this exercise before the next one.
NOTE 2: All your code goes inside the functions.js file and this is the only file you submit in this exercise.
NOTE 3: Do not rename the functions or else tests won’t be able to detect and use them.
NOTE 4: This is important and needs to be repeated! The functions you implement here are needed in the next exercise. That is, you must complete this exercise before the next one.
Open index.html in your browser. If your functions are implemented correctly
you should see a table looking similar to the table in the image above.
Attention
If your submission is not accepted here are a few tips on testing your functions.
Open your index.html in the browser. Verify that your function can be found from the window by opening the console and writing:
buildRowData(techStats, ["JavaScript", "PHP"], 2012, 2015)
The return value should be something like:
Array [ (5) […], (5) […] ]
If previous step looked fine try to write:
const rowData = buildRowData(techStats, ["JavaScript", "PHP"], 2012, 2015)
constructTableRowsHtml(rowData)
This time you should receive the following HTML string (it does not all have to be on one line):
"<tr><td>JavaScript</td><td>3129</td><td>4743</td><td>3784</td><td>11970</td></tr><tr><td>PHP</td><td>1926</td><td>2328</td><td>1713</td><td>6531</td></tr>"
Finally test constructTableHeadHtml with typing:
constructTableHeadHtml(["Technology", 2012, 2013, 2014, 2015])
The result should be:
"<tr><th>Technology</th><th>2012</th><th>2013</th><th>2014</th><th>2015</th></tr>"
A+ presents the exercise submission form here.