Manipulating Stack Overflow data
Attention
This exercise should be done in groups and submitted as a group.
Include all group members and make sure that everyone knows how your solution works. Only one group member needs to submit the exercise on behalf of the whole group.
In most cases the data you have to work with is not in the correct format and it needs to be manipulated and transformed to a different format to be useful.
In this exercise, you work with the same Stack Overflow survey data which you were using in the last exercise but this time the data needs to be transformed into a different format before it can be used.
NOTE: You need the functions from the previous exercise here too. Finish that exercise first!!
Download the template
Instructions
Begin by downloading and extracting the exercise files. You should have the following five files:
functions.jsthis file is for your functions. You will edit and submit only this file.index.htmlthis file is responsible for loading all the other files and showing the final results.style.cssstylesheet to make the table look like the one in the image above.index.jsis responsible for calling all the functions you implement and then updating the HTML table based on the results.stackOverflow.jsthis file contains yearly numbers of people who were at the time of the survey working with each technology or would like to work with each technology in the future. Compared to the previous exercise there is now more data. Not only the current technologies are included but also technologies for the future. The structure of the data is shown below (although there will be more data):const stackOverflowStats = { 2016: { currentTech: { Angular: 8823, JavaScript: 27385, PHP: 12780, Python: 12282, React: 2541, }, futureTech: { JavaScript: 18012, PHP: 6541, Angular: 11013, Python: 13495, React: 6597 } }, 2017: { currentTech: { JavaScript: 22998, Python: 11816, PHP: 10371, }, futureTech: { Python: 12458, JavaScript: 16204, PHP: 5284 }, currentDbs: {}, futureDbs: {}, currentLibs: { React: 6140, Angular: 12023 }, futureLibs: { React: 6733, Angular: 7019 }, currentPlatforms: {}, futurePlatforms: {} } };
As you can see the object stackOverflowStats has different keys in the objects under different years. In this exercise we are only interested in the current technologies which appear under any of the keys which start with the word current.
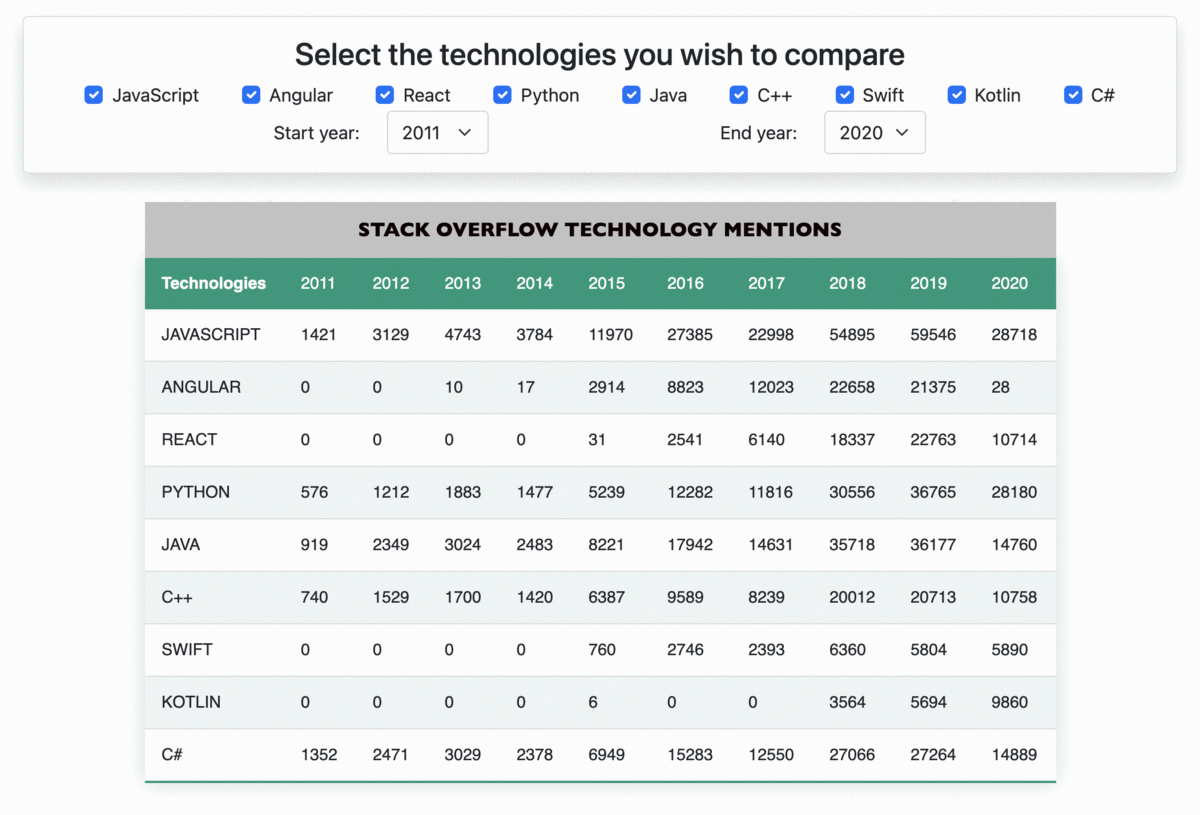
In this exercise you will implement two new functions and use also all the functions from the previous exercise. Together these functions are used to build a more interactive table of technologies. The image above shows the expected result. As you can see the table is now more dynamic and updates according to user’s selections.
These actions includes:
Selecting a start year
Selecting an end year
Selecting a technology
Deselecting a technology
Each of these actions will trigger the table to be updated accordingly. Your task will be to provide the data and functions needed to update the table.
In the previous exercise, you were given techStats.js file which had the yearly
technology statistics from the Stack Overflow survey data. However, in this exercise
your task is to provide a function which builds that same data from the data
in stackOverflow.js.
Your task is to implement the following functions described in the
functions.js file:
buildRowData(yearlyTechStats, selectedTechs, firstYear, lastYear)Copy your function from previous exerciseconstructTableRowsHtml(rowData)Copy your function from previous exerciseconstructTableHeadHtml(headings)Copy your function from previous exercisefunction buildYearlyTechStats (techStats)
Takes stackOverflowStats or similarly structured object as only argument and builds and returns the yearly technology statistics you are familiar with from the techStats object in the previous exercise having the following format:
{
  "2011": {
    "JavaScript": 1421,
    "Java": 919,
    "PHP": 789,
    "Python": 576
  },
  "2012": {
    "Java": 2349,
    "JavaScript": 3129,
    "PHP": 1926,
    "Python": 1212
  },
  "2013": {
    "Java": 3024,
    "JavaScript": 4743,
    "PHP": 2328,
    "Python": 1883,
  }
}
Include only data from current technologies i.e. only keys which start with the word current. (currentTech, currentDbs, etc.)
function updateTable (table, yearlyTechStats, selectedTechs, firstYear, lastYear)
Updates HTML table based on the selected technologies and statistics
Takes five arguments:
table: HTMLTableElement this is a DOM element of the HTML table to be updated
yearlyTechStats: object of the same format
buildYearlyTechStats()function returns andbuildRowData()accepts as its first argumentselectedTechs: array of technologies which are selected to be shown in the HTML table
firstYear and lastYear: integers representing the range of years from the statistics to be included in the HTML table. You can assume that firstYear <= lastYear
Uses
buildRowData(),constructTableHeadHtml(), and`constructTableRowsHtml()to update the table. You should replace the table head and body (<thead> and <tbody>) with the HTML generated by your functions.
NOTE 1: All your code goes inside the functions.js file and this is the only file you submit in this exercise.
NOTE 2: Do not rename the functions or else tests won’t be able to detect and use them.
Open index.html in your browser. If your functions are implemented correctly
you should see a table looking similar to the table in the image above.
Attention
If your submission is not accepted here are a few tips on testing your functions.
Open your index.html in the browser. Verify that your function can be found from the window by opening the console and writing:
buildYearlyTechStats(stackOverflowStats)
The return value should be something like:
Object { 2011: {…}, 2012: {…}, 2013: {…}, 2014: {…}, 2015: {…}, 2016: {…}, 2017: {…}, 2018: {…}, 2019: {…}, 2020: {…} }
If previous step looked fine try to write:
const yearlyTechStats = buildYearlyTechStats(stackOverflowStats)
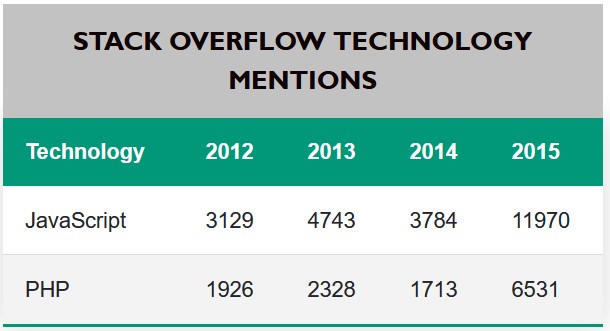
const rowData = buildRowData(yearlyTechStats, ["JavaScript", "PHP"], 2012, 2015)
constructTableRowsHtml(rowData)
This time you should receive the following HTML (it does not all have to be on one line):
"<tr><td>JavaScript</td><td>3129</td><td>4743</td><td>3784</td><td>11970</td></tr><tr><td>PHP</td><td>1926</td><td>2328</td><td>1713</td><td>6531</td></tr>"
Finally test updateTable with typing:
const table = document.querySelector('table')
updateTable(table, yearlyTechStats, ["JavaScript", "PHP"], 2012, 2015)
The result should be:
undefined
but the table on the page should be updated to the following:
A+ presents the exercise submission form here.